
The old maintenance approach was traditionally based on replacing the equipment’s components at the right time, just before they fail. This viewpoint was derived from the belief that all the components would progressively wear down until they finally fail. 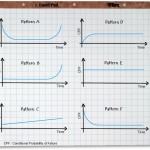 Nowadays, the modern maintenance approach is based on the fact that only a small percentage of equipment actually follow this behaviour. However, since the classic belief is somewhat intuitive, there are still many maintenance departments who base their maintenance strategy on it.
Let’s have a look at the different ways a component can fail during its operating life.
During the 60’s, the aviation industry was struggling to keep commercial airplanes at acceptable levels of reliability. They had underpinned their maintenance approach on overhauls and component replacements, but the results showed that something wasn’t quite right.
After a comprehensive study, they discovered that in fact there are six main failure patterns.
The charts below show them all. On the Y-axis we have the conditional probability of failure against operating age and on the X-axis we have the operating age of the component. In other words, these charts show the probability of failure through the component’s life so we can see how it evolves in time.

The Six Failure Patterns
Now let’s have a closer look at each of them:
Failure pattern A
 This is the most famous failure pattern. It’s commonly known as bathtube, due to its shape. We can identify three main zones. First, a high failure probability at the beginning of the operating life that decreases until it became stable. This zone is called infant mortality and means that when we install a new component there is an initial high risk of failure. The second zone is the rest of the useful life with a lower and constant failure probability. Finally, at the end, we identify a wear-out zone.
In this pattern, replacing the component before reaching this last zone will reduce the failure probability. However, we need to take into consideration that we are also introducing high chances of early failures due to infant mortality.
Failure pattern B
 This pattern is the same as the previous one but without the infant mortality zone at the beginning. Sometimes the absence of this initial zone is a characteristic of the component itself and other times is because the manufacturer had eliminated all the components with early defects. This elimination process is commonly known as burnout test.
As well as in the pattern A, replacing the component before the wear-out zone is a good way of reducing the chances of failure and in this particular case we are not introducing extra failure possibilities due to infant mortality.
Failure pattern C
 In this pattern, the conditional probability increases at a constant rate along the life of the component. We can’t identify a definite wear-out zone so, there isn’t an optimum time to replace the item. Nevertheless, we could replace the component when the failure probability reaches a certain value that is no longer acceptable for us.
Failure pattern D
 This pattern shows a really low probability of failure at the beginning of the component’s life which then increases up to a certain level that remain constant through the rest of its operating life. It’s worth remarking that this area with a constant conditional probability shows us that the failures occur randomly. In this way, the replacement of a component won’t bring up any benefit except for the already mentioned brief period of low failure probability at the beginning, which is truly insignificant compared to the rest of the useful life of the component.
Failure pattern E
 This pattern shows a constant failure probability along the component’s life. We call this pattern a random failure distribution. Here, there is nothing that a component replacement can do to reduce the probability of a failure.
Failure pattern F
 This pattern is also a random failure distribution, but with an infant mortality area at the beginning. In this case, replacing a component not only won’t bring up any benefit but also will increase the failure probability because we are introducing the initial high failure probability area of the new component’s infant mortality.
Now that we have identified the different patterns, it’s time to analyze how the failure patterns are distributed among the components. That study in the 60’s showed that for civil aviation, the components that belonged to each pattern were distributed as shown below:


These percentages come from the aviation industry, but are highly transferable to complex equipment in other fields and industries. The first conclusion is that in 68% of the cases (Pattern F), if we perform a scheduled replacement we are increasing the chances of failures. Moreover, in almost 90% of the cases (patterns D, E and F) that practice won’t be effective at all.
In future posts I’ll discuss the best approaches for every case and their implications. Stay tuned so you don’t miss it out.
How is the maintenance approach in your workplace? Are you underpinning your strategy in component replacements? Share your opinion below!
Thanks for reading.
Interesting study, do you know if this was across many types of parts and materials or more focused?
Pretty great post. I just stumbled upon your weblog and wished to say that I have really loved surfing around your blog posts.
In any case I’ll be subscribing to your feed and I’m hoping you write again soon!
Thanks for the post Claudio, I always find that not enough people are aware of these failure pattersn nor do they really understand how to use them when it comes to real life maintenance decisions.
I also found this useful and valuable. Thank you.